Menu
Close
Close
Discover how 21st Century Pain Management redefines clinic branding with our innovative...

Meet Artior our latest brand transformation that turns interior design into a statement of...

Discover 'Bake me Happi,' where we blend delight with culinary artistry to create unforgettable...

Witness the magic of 'Bloom Beauty'! We specialize in transforming skincare brands with a...

Cottread our latest creation that turns apparel into an icon of style and sophistication. We craft...

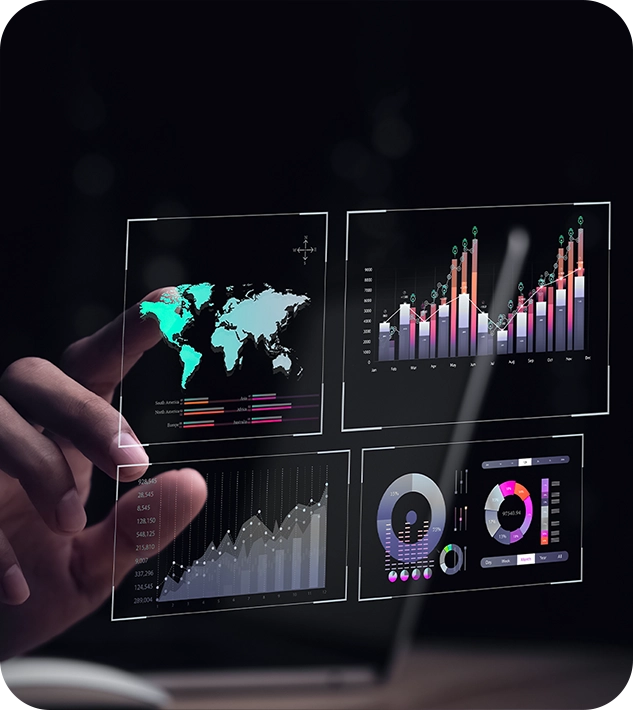
Accelerate time to insights by bringing life to your data with the best data visualization tools. Our services enable you to visualize information clearly, allowing you to navigate vast amounts of data freely. With Fleekbiz’s data visualization consulting, your team can shift from manual monitoring to automated processes, driving faster and more informed decision-making.
Choosing the right platform is crucial for your business. Fleekbiz’s data visualization software comparison service helps you evaluate and select the top data visualization platforms that best fit your organization. We provide expert guidance, ensuring that the software you choose can handle your data volumes and meet your specific needs, allowing you to act swiftly and confidently.
Your brand can provide customers with an enhanced 3D visualization of your products – it can offer your customers a more focused – detailed understanding and mindful appreciation of what you offer firsthand. Whether at home or on the go, remote product demonstrations through AR/VR make it easier for your customers to explore – engage – buy your products – boost confidence – encourage more purchases. Augmented reality technology companies are famous for ensuring that all your visuals captivate – convince – convert your audience.
Automate your data visualization process with the best data visualization software, tailored to your unique business needs. By automating the analysis and monitoring of data, your employees can focus on deriving actionable insights rather than managing endless numerical data. This shift allows for quicker, well-informed business decisions that keep you ahead of the competition.
Baffling reports and endless spreadsheets can be overwhelming. With custom business data visualization solutions from Fleekbiz, you can grasp large volumes of data instantly through graphical representations. Our services help you accelerate data-driven decision-making at every level, ensuring that your business remains at the forefront of your industry.
Are you worried about missing weak points or anomalies in your data? Fleekbiz’s interactive data visualization software uncovers hidden patterns that are often lost in traditional spreadsheets. With high-quality visualization, your team can communicate and collaborate more effectively, turning oceans of data into rich, actionable insights that drive impactful results.

Boost your business intelligence with customized dashboards from Fleekbiz. We tailor dashboards to fit any data source or KPI, enhancing data accessibility and decision-making capabilities.
Struggling with data overload? Fleekbiz optimizes your dashboards to highlight key KPIs with filter options, reducing load time and improving real-time output based on your business needs.
Prepare your data for effective business intelligence with Fleekbiz. We handle data collection, cleaning, and consolidation, transforming raw data into interactive reports for better insights.
Fleekbiz designs modern data platforms to provide seamless access to business insights across departments. Our innovative methods ensure you find the right insights quickly and efficiently.
Data visualization simplifies complex data sets, making it easier to identify trends, patterns, and outliers. This enables quicker and more informed decision-making, driving better business outcomes by allowing stakeholders to see the story behind the data.
Yes, we specialize in creating custom data visualization solutions that align with your business objectives. Whether you need interactive dashboards, real-time data visualization, or tailored reporting tools, we work closely with you to develop solutions that meet your specific goals.
We implement rigorous data validation processes to ensure the accuracy and reliability of the visualized data. Our approach includes data cleansing, verification against source data, and continuous monitoring to maintain data integrity across all visualizations.
We start with a comprehensive assessment of your current systems and data architecture. From there, we develop an integration plan that includes data mapping, tool selection, and implementation strategies. Our team ensures a seamless integration process with minimal disruption to your operations.
Data security is a top priority for us. We employ industry-standard encryption, access controls, and compliance with relevant regulations such as GDPR and HIPAA to ensure that your sensitive data is protected throughout the visualization process.
We offer comprehensive support and maintenance services, including regular updates, troubleshooting, and optimization of your data visualization tools. Our team is available to assist with any issues or enhancements needed to ensure your visualizations remain effective and up-to-date.
Our services transform raw data into actionable insights, enabling your team to make data-driven decisions. By visualizing key performance indicators, tracking progress, and identifying opportunities, we help you optimize business operations and drive growth.
© 2024 Fleekbiz. All Rights Reserved. | Powered By ICG
USA Office
© 2024 Fleekbiz. All Rights Reserved. | Powered By ICG
© 2024 Fleekbiz. All Rights Reserved. | Powered By ICG